Vision Zero Dashboard

JMT developed the Vision Zero online dashboard to assist Anne Arundel County, MD’s data-driven mission to eliminate traffic-related injuries and deaths. The JMT Technology Group worked in coordination with our traffic engineers to collate, map, and circulate important vehicular crash data. Our team first conducted data analysis and GIS mapping to identify and differentiate high-risk traffic areas within the County. This information was then made available to both County residents and employees on an interactive multimedia online platform. The tool is extremely self-sufficient by way of automated data upload and predictive modeling. The project was awarded the County Project of the Year for the Small Project Category.
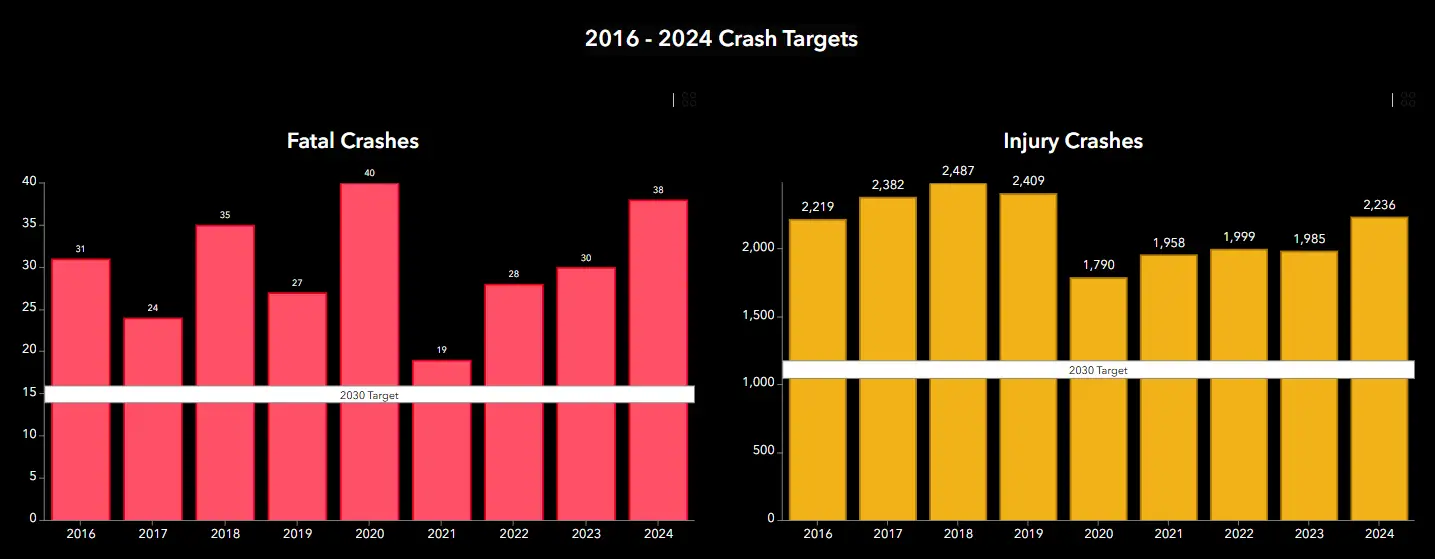
Vision Zero is a multi-national traffic safety initiative whose underlying principle is that traffic injuries and deaths are preventable. Anne Arundel County’s Vision Zero mission includes goals to reduce traffic fatalities by 50% by 2030 and to eliminate traffic-related deaths completely by 2040. The County prioritizes data investigation to inform actionable roadway improvements, public-safety efforts, and interim goal setting. Ultimately, Anne Arundel County will be able to use the dashboard to analyze crashes and target effective solutions through optimized funding allocation.

Before undertaking the key data investigation and web development phases of the project, JMT reviewed the County’s Vision Zero Plan, updated in May 2022, to understand the County’s goals and our role. Anne Arundel County’s plan adopted a holistic approach to its ambitious traffic safety program. This meant the involvement of public and private institutions, community members, and relevant firms such as JMT. JMT’s group of experienced traffic engineers made several suggestions for the Anne Arundel Vision Zero Plan, including setting measurable interim goals, developing a Local Road Safety Plan to access FHWA funding, creating public outreach communication channels, expanding statistical networks to include all relevant and up-to-date traffic data, and including easily visible and accessible online features to increase the actionability of data investigations.
When JMT’s traffic group began work on this project, data was only available for the 2012-2021 period from the Maryland Highway Safety Office. JMT cleaned and analyzed data from the Maryland State Police and suggested the incorporation of data from the Maryland Office of Traffic Safety. This data was then used in conjunction with one of Esri’s newest tools, the ArcGIS Experience Builder, to develop the dynamic Vision Zero dashboard. The ArcGIS Experience Builder allows data to be continually integrated from the Maryland State Police databases along with other crowd-sourced, historic, or near-real-time data. The dynamic dashboard we created automatically updates with new data, making it a low-maintenance, self-sustaining application.
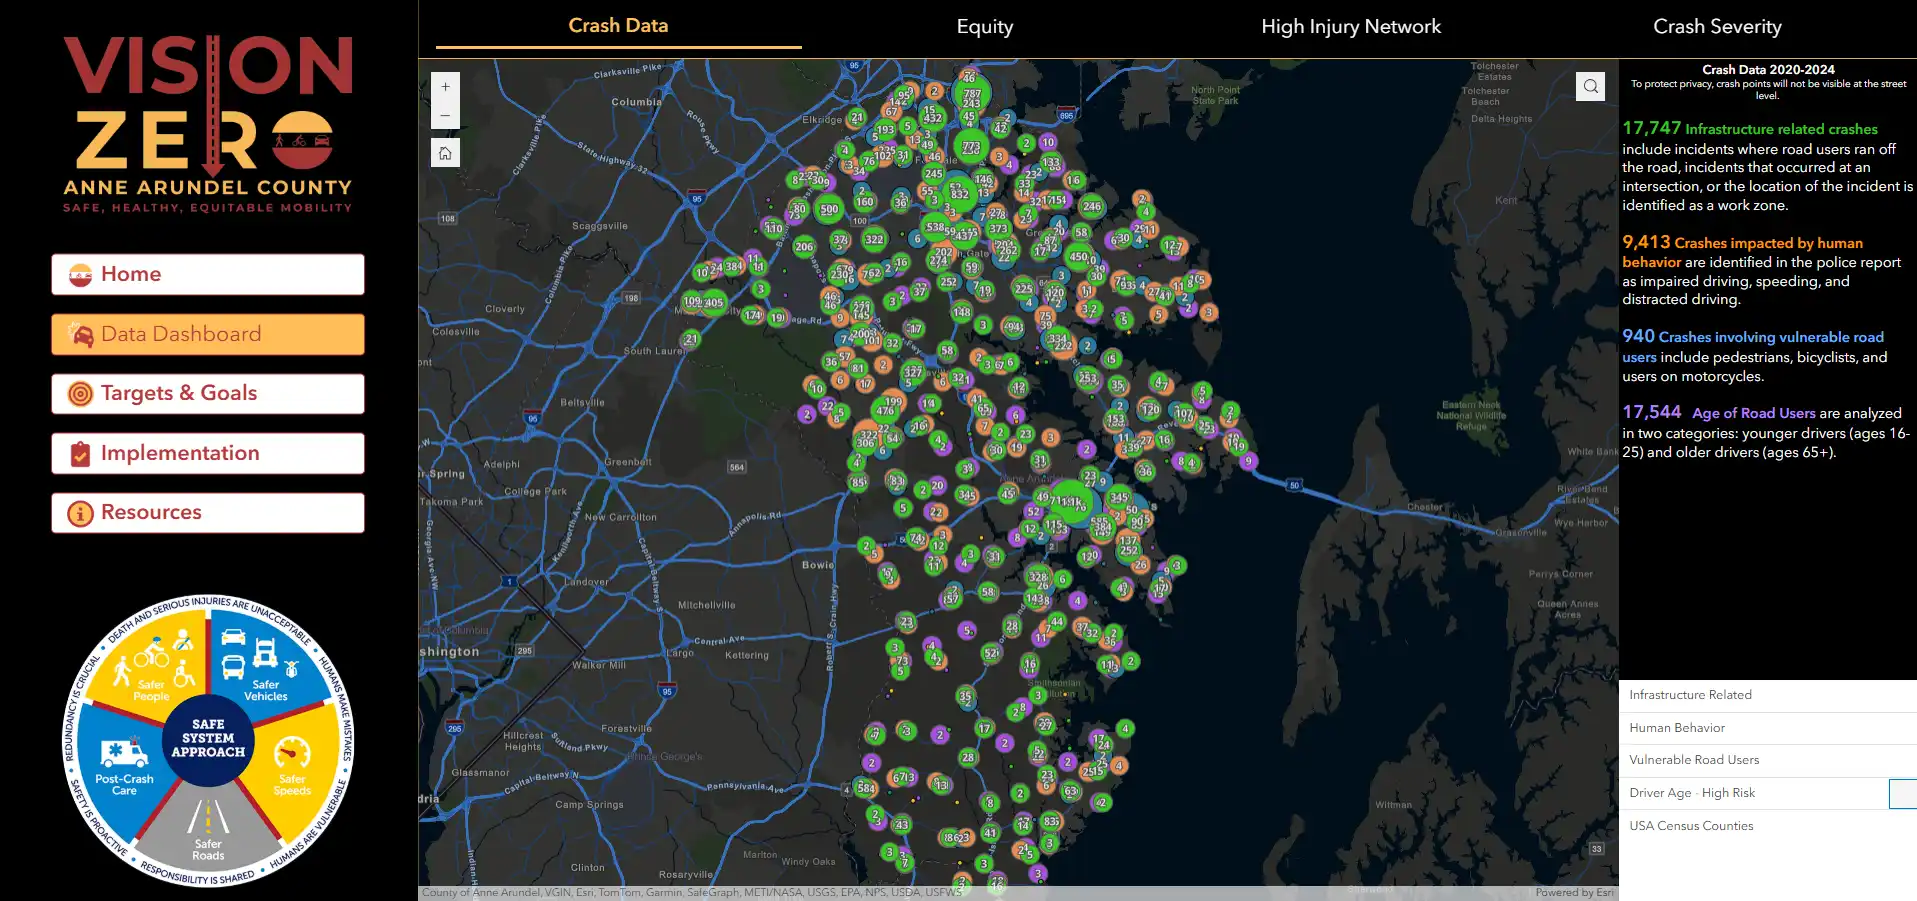
The Vision Zero dashboard was a breakthrough technological tool for the County’s safety review processes and public outreach efforts. The dashboard was developed to visualize crash reports on a familiar County map background. The dashboard serves two user groups: the public and county employees with ArcGIS login access. Both groups can interact with the map, toggle layers, and filter crash clusters based on infrastructure, human behavior, vulnerable road users, and road user age.
JMT’s team configured the internal dashboard for county employees with a focus on multiple aspects of roadway safety work. The detailed map discloses specific crash points and detailed crash data for the purpose of analyzing and understanding crash trends in Anne Arundel County. Internal users can filter the data based on crash type, severity, chronology, equity, contributing factors, and roadway attributes. The user can view the details of a single crash or select an area on the map and view the details for a group of crashes. The data can be viewed in a table format and exported for further analysis. The detailed information provides the County’s Vision Zero team with an adept home database to evaluate and strategize.

Crash data presented through the Vision Zero dashboard will help Anne Arundel traffic planners and engineers make informed decisions about road design, traffic flow, and appropriate safety mitigation measures. They can analyze historical crash data to identify crash patterns and implement proven safety countermeasures to improve safety. The database also includes roadway assets, such as guardrails, roadway lighting, and pedestrian infrastructure, which can be visualized along with the crash data to determine where roadway assets may be lacking. Traffic engineers can also identify areas of roadway congestion where infrastructure improvements are necessary.
JMT laid the groundwork to develop a predictive model through the GIS platform. Although data such as Average Daily Traffic is insufficient to complete this analysis tool currently, the predictive model can be further developed in the future as the dashboard updates with more data. The predictive model will help identify new roadway possibilities, greatest roadway improvement potentials, significant traffic flow changes, and crash data deficiencies.
The external, public-facing page has four sections: Crash Data, Equity, High Injury Network, and Crash Severity. The Crash Data section serves as the home page and provides clickable crash clusters and general information on crash causes. The Equity, High Injury Network, and Crash Severity sections allow the public to better understand the crashes in Anne Arundel County with map clustering based on these three respective factors. Dynamic charts allow users to view the total number of fatal and non-fatal crashes each year for the duration of the available data. As opposed to the internal site, public users can only view crashes in clusters to protect the privacy of the individuals involved. The external site also provides users with County targets and goals, implementation plans, and resources about Anne Arundel County’s Vision Zero Program.
The external site is a valuable tool for raising public awareness about Anne Arundel County’s Vision Zero goals. The platform can help Anne Arundel County identify areas of need and engage with community members to better understand their transportation needs and concerns. Anne Arundel County can use the data to create public safety campaigns and educational materials targeting specific issues that contribute to crashes, such as distracted driving or speeding. As the public dashboard is connected to the County’s overall Vision Zero website, any campaign material can be easily accessed when viewing the dashboard.
The High Injury Network is perhaps the most important feature of the dashboard. This map clusters crashes within 2000 feet of each other and highlights those areas with the highest crash density. The crash data on the dashboard will allow Anne Arundel County to easily identify where the most severe crashes are occurring and identify high injury networks with a history of frequent severe injury and fatal crashes. This information enables targeted safety interventions to reduce severe crashes. Currently, the high injury network focuses only on the number of crashes per mile. Crash rates in vehicle miles traveled are not yet available due to a lack of volume data for all facilities. This project identified the need for more data collection and developed plans to incorporate newly available crash-rate data in the future.
Another important aspect of the data dashboard is the visualization of inequity. The dashboard allows users to identify Equity Emphasis Areas and vulnerable citizens by visualizing socio-economic data and high pedestrian and bicycle areas. This will help Anne Arundel County to continue its targeted prioritization schedule with a focus on low-income communities and communities of color disproportionately affected by fatal or injurious crashes. By focusing on equity and social justice, the platform can help reduce disparities in road safety outcomes.
JMT’s work for the Vision Zero dashboard has propelled the Anne Arundel County traffic safety program to a number of positive changes. Since the dashboard’s introduction, the County has installed red-light cameras at significant intersections and portable camera units in residential areas and school zones. These solutions and their respective locations were chosen based on the data analytics tools of the dashboard. JMT is once again happy to have contributed to improving the quality of life for the communities we serve.